
GRI Blog
Mapping of Invasive Phragmites (Common Reed) in Gulf of Mexico Coastal Wetlands Using Multispectral Imagery and Small Unmanned Aerial Systems
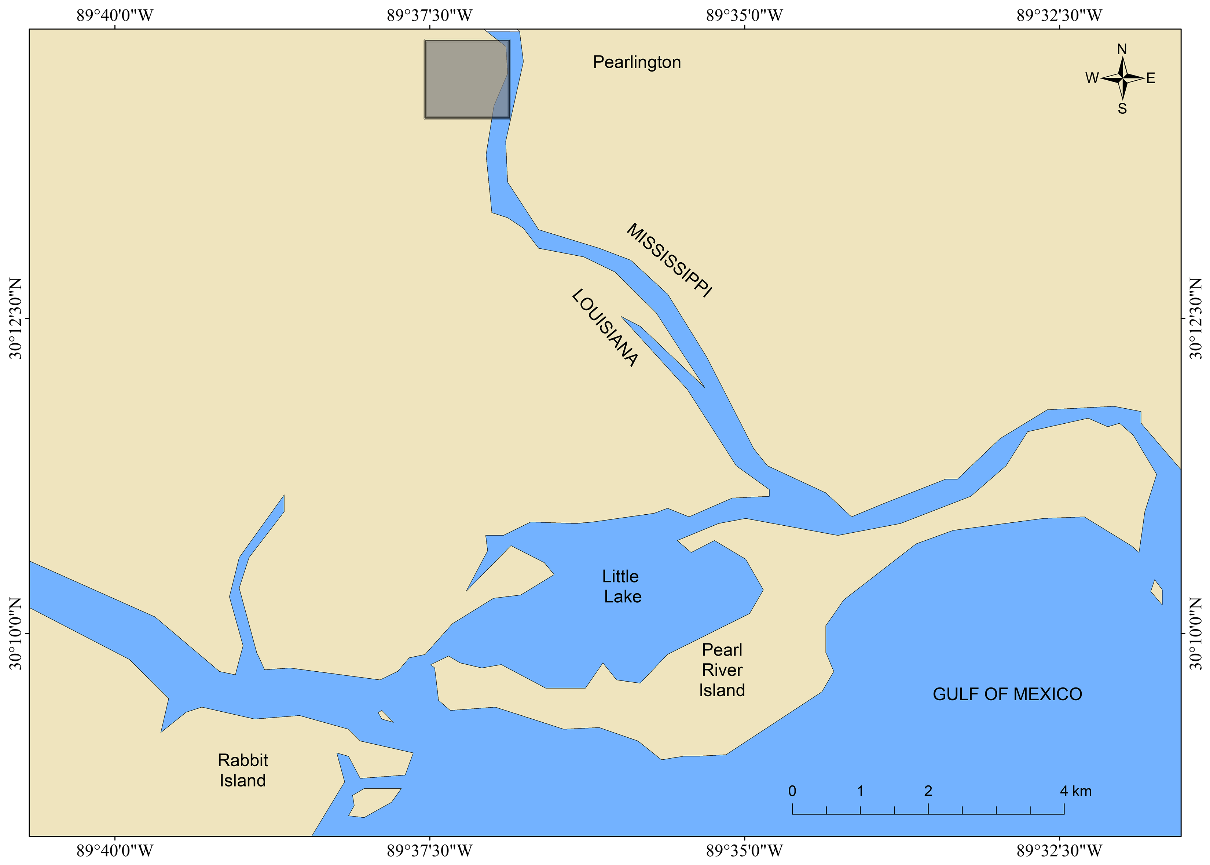
Figure 1. The study site (shown in grey) near Pearlington, Mississippi, USA (about 66 ha) selected for developing and evaluating techniques to map invasive Phragmites.
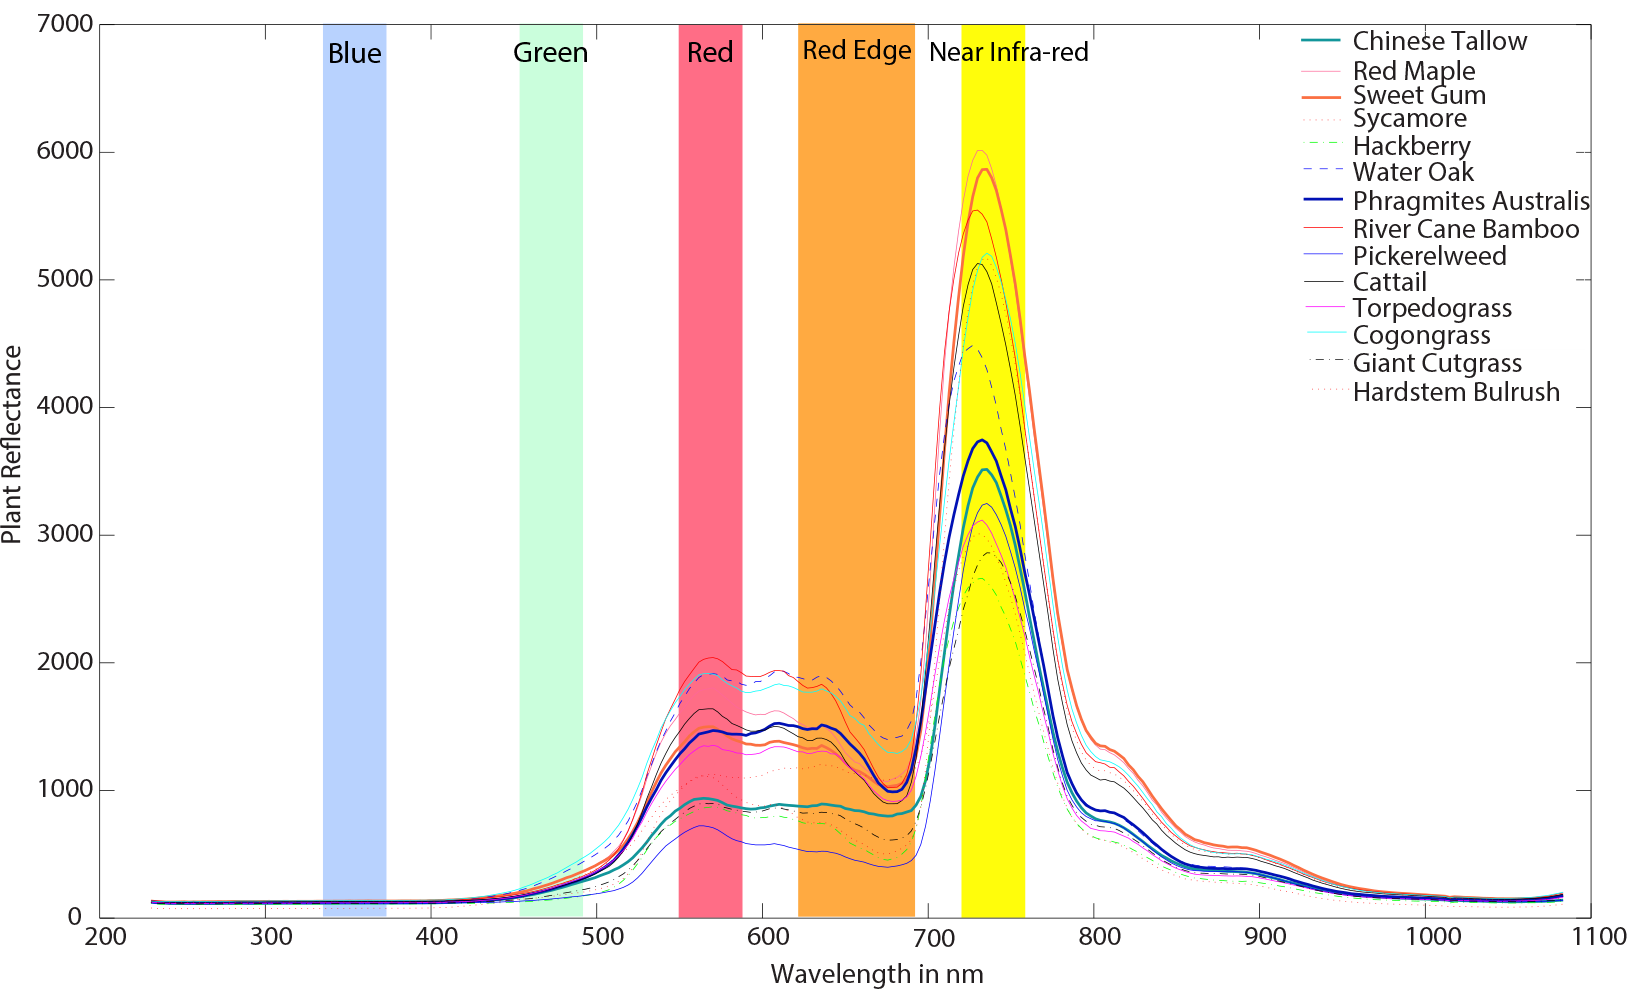
Figure 2. Typical plant reflectance characteristics of various wetland plants and spectral response of MicaSense RedEdge camera.
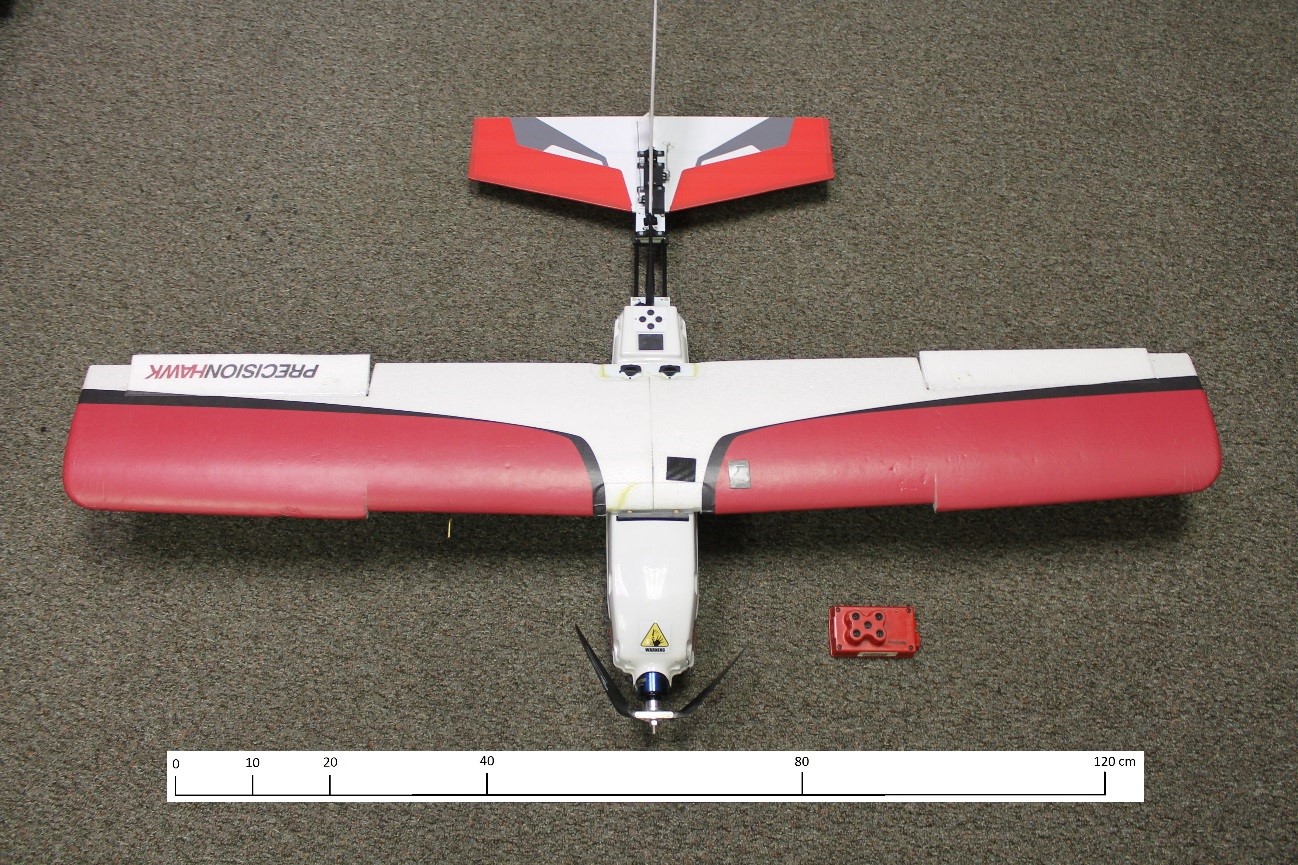
Figure 3. Precision Hawk Lancaster UAV with 5-band MSRE multispectral sensor
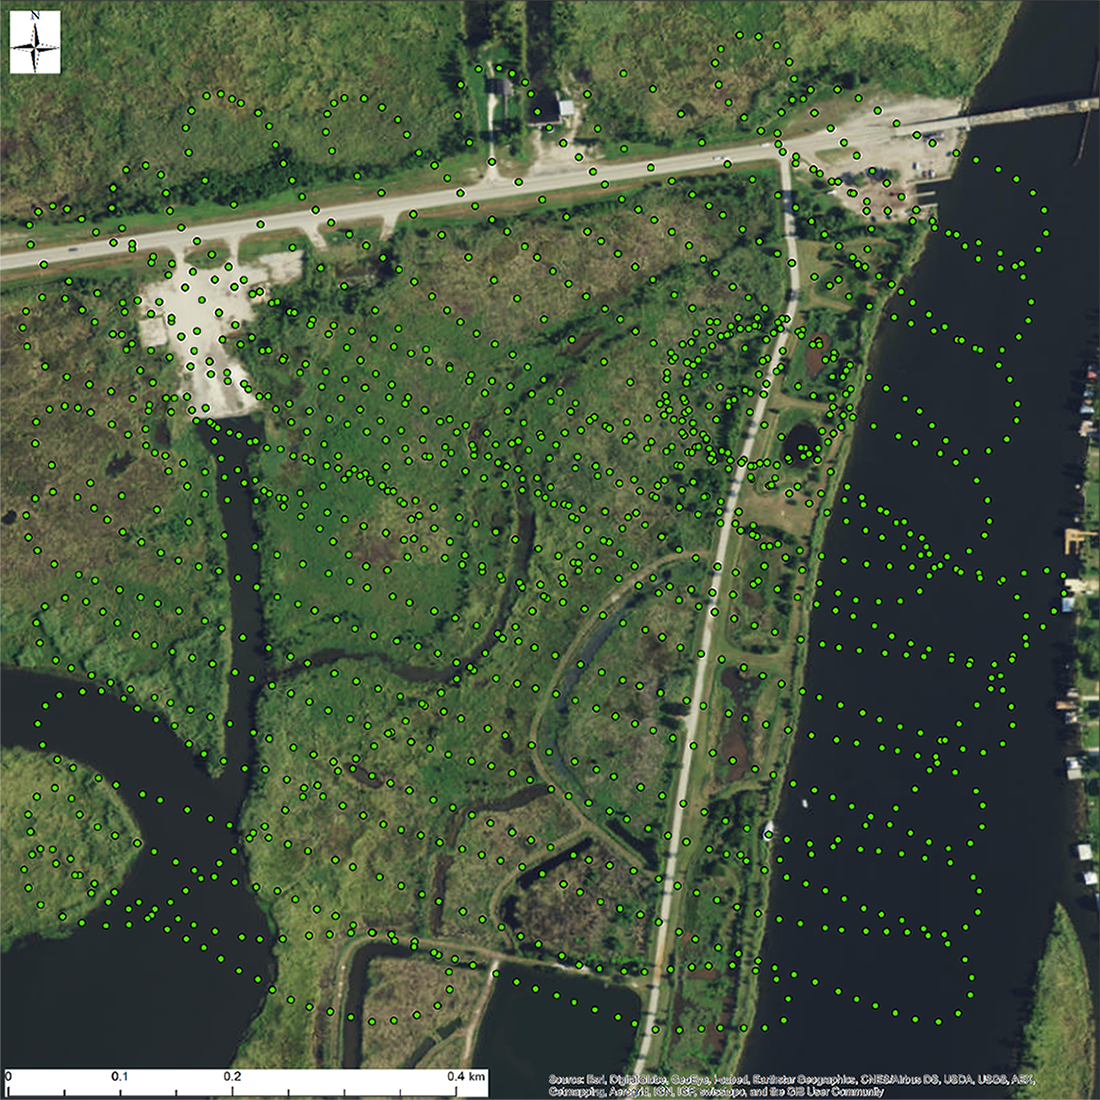
Figure 4. Camera trigger point locations (shown as Green dots) where the images are captured with MSRE camera to construct the orthomosaic.
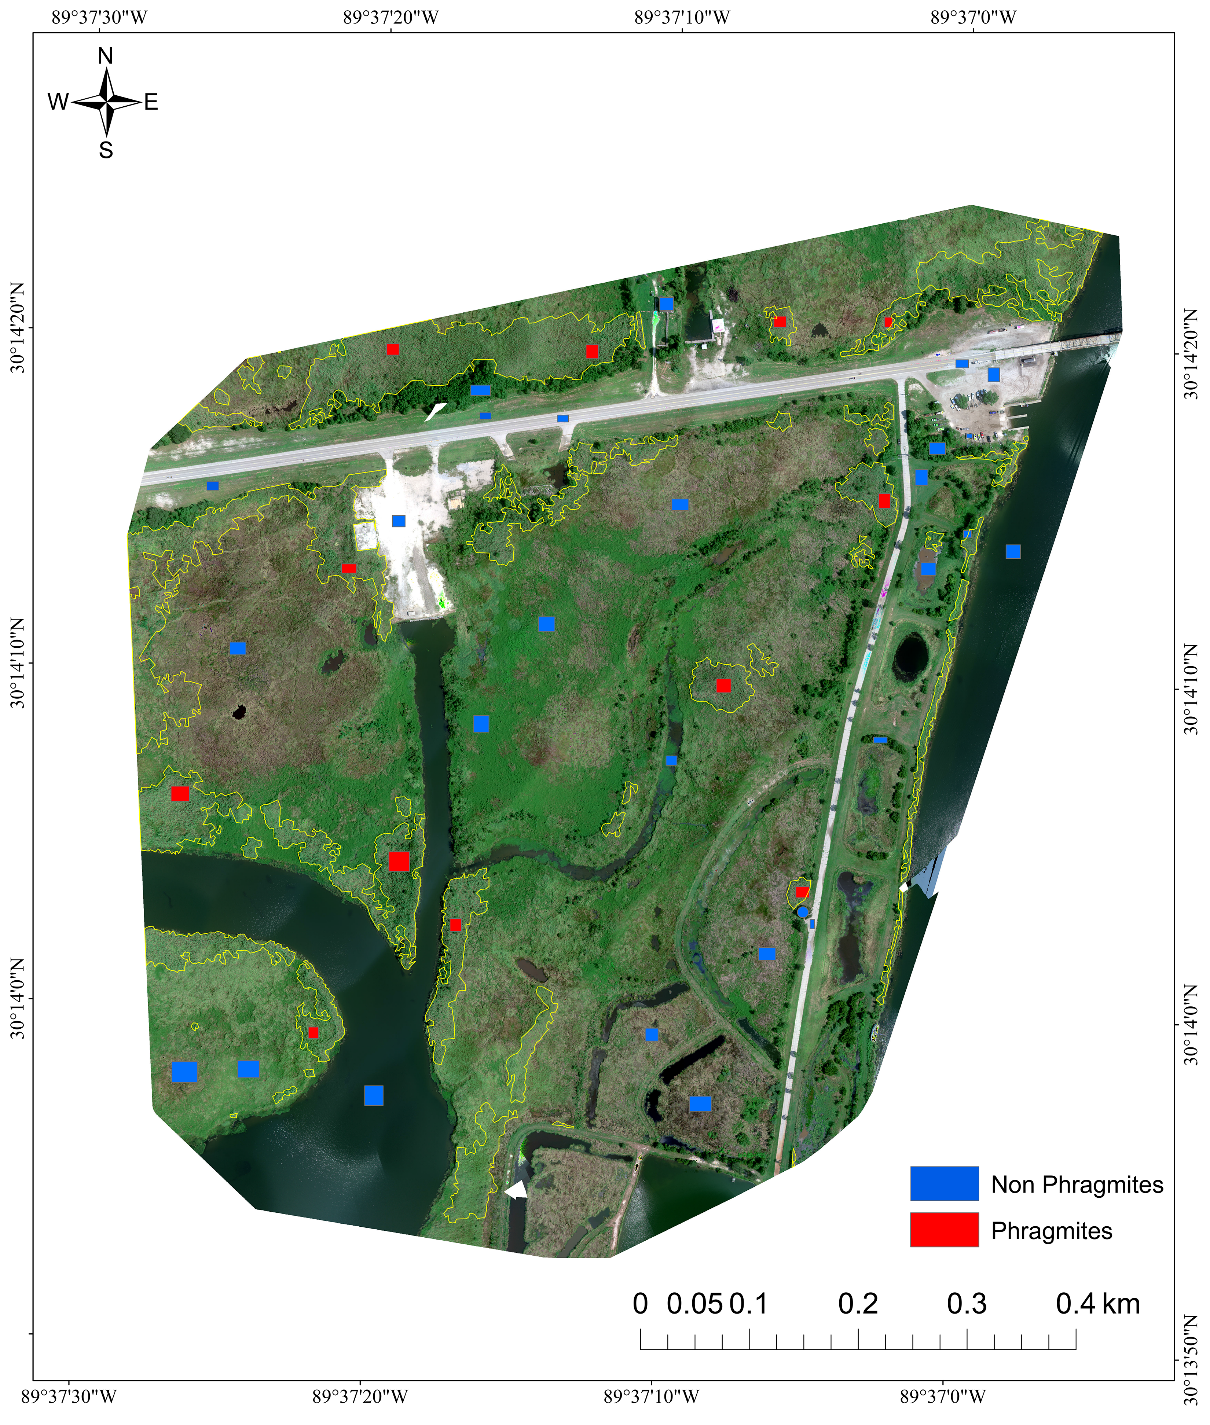
Figure 5. The study area with ground reference of Phragmites (boundaries are shown in yellow).
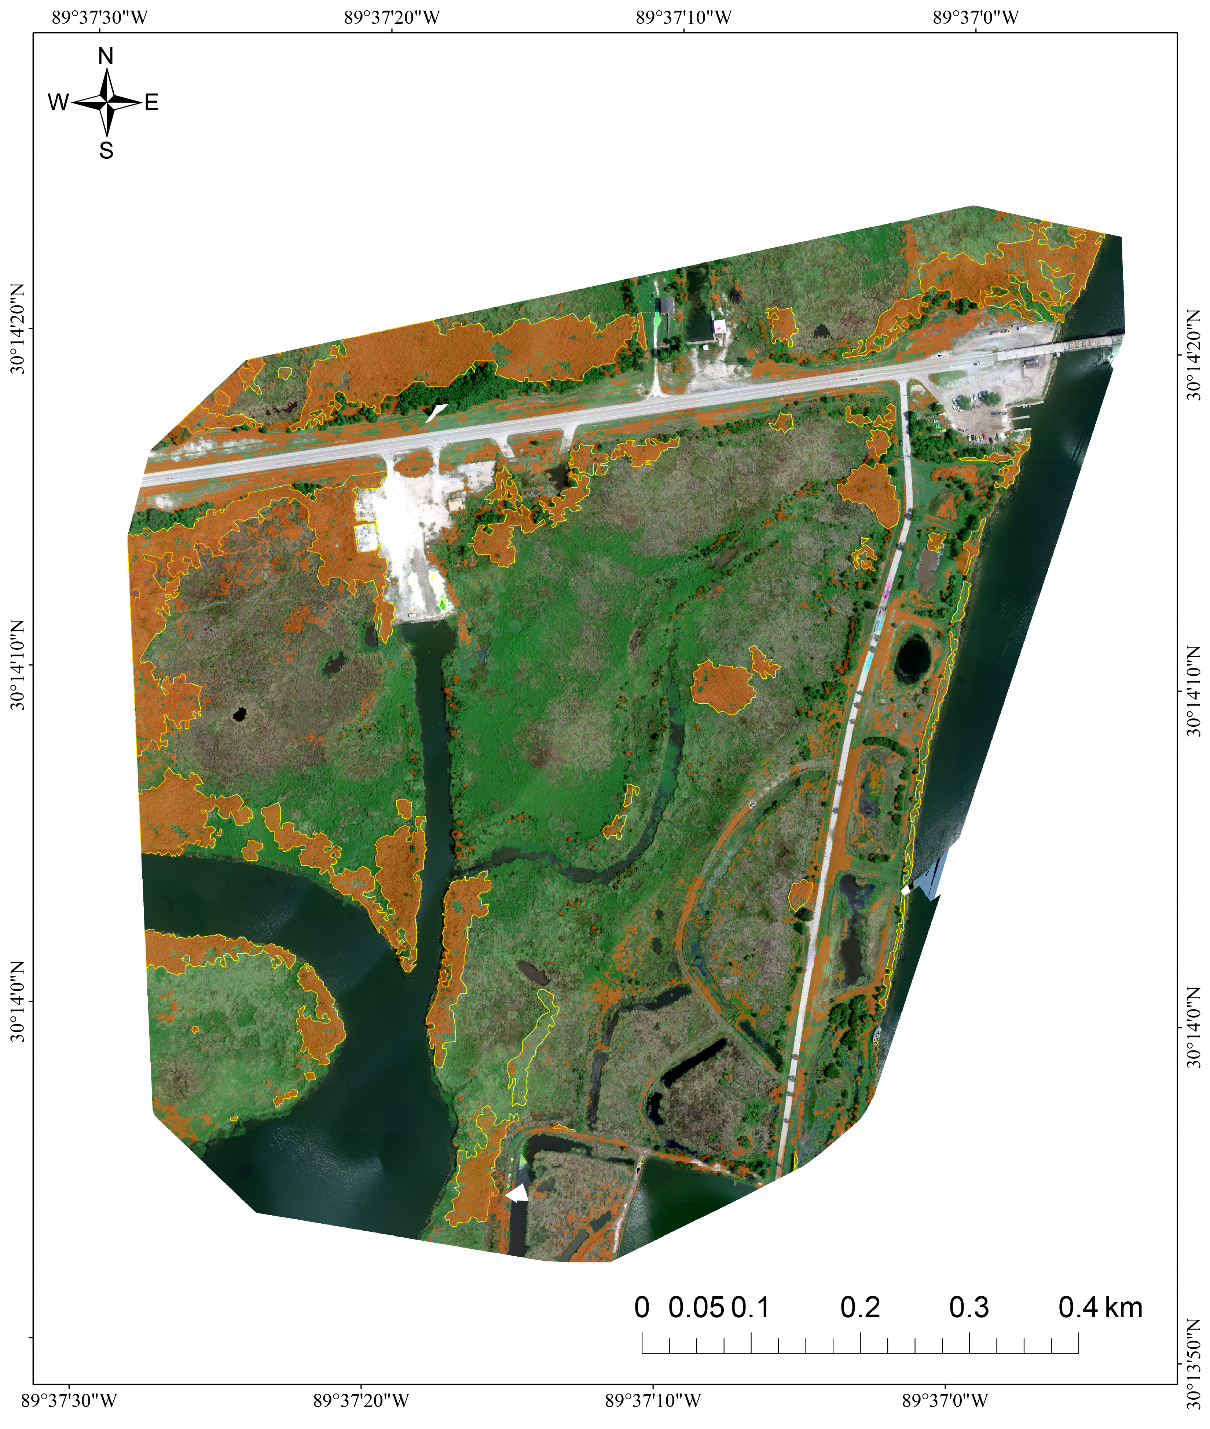
Figure 6. Phragmites classification maps produced by using MSRE bands, DSM, NDVI, SAVI, MAP - MOI as features (Phragmites GR areas are outlined in yellow and the classification map is overlayed in orange with 50% transparancy)
Introduction
In coastal wetlands of the Gulf of Mexico, the invasive plant species Phragmites australis (common reed) rapidly alters the ecology of a site by shifting plant communities from heterogeneous mixtures of plant species to homogenous stands of Phragmites. Phragmites grows in very dense stands at an average height of 4.6 m and outcompetes native plants for resources. To restore affected wetlands, resource managers require an accurate map of Phragmites locations. Previous studies have used satellite and manned aircraft based remote-sensing images to map Phragmites in relatively large areas at a coarse scale; however, low altitude high spatial resolution pixel-based classification approaches would improve the mapping accuracy. This study explores the supervised classification methods to accurately map Phragmites in coastal wetlands at the delta of the Pearl River in Louisiana and Mississippi, USA using high resolution (8 cm ground sample distance) multispectral imagery collected from a small unmanned aerial system platform at an altitude of 120 m. We create a map through pixel based support vector machines classification using blue, green, red, red edge, and near infra-red spectral bands along with a digital surface model, vegetation indices and morphological attribute profiles as features. This study also demonstrates the effects of different features and their usefulness in generating an accurate map of Phragmites locations. Accuracy assessment based on a) a subset of training/testing samples (to show classifier performance), and b) the entire ground reference map (to show the quality of mapping) is demonstrated. Kappa, overall accuracy, class accuracies and their confidence intervals are reported. An overall accuracy of 91% and Kappa of 63 is achieved. The results of this study indicate that features such as morphological attribute profiles are very useful in accurately mapping invasive Phragmites compared to existing region-based approaches. Complete research and analysis of this study to be published in the special UAV research issue in the International Journal of Remote Sensing URL: http://dx.doi.org/10.1080/01431161.2016.1271480
Study area and image acquisition
Our study site is located in the delta of the lower Pearl River which spans southwest Mississippi and southeast Louisiana. The region is classified as a freshwater tidal marsh which is influenced by the daily influx of tides, yet it has a salinity of less than 0.5 ppt. This area harbors a diverse ecological community. The region around Desert Island (about 66 ha) was chosen as a study site to evaluate the supervised classification (Figure 1). The site is in the lower Pearl River basin west of Pearlington, Mississippi and north and south of U.S. Highway 90. This site was selected because of its ecological and landscape diversity as it contains all prominent land/vegetation cover types in the region and is a reasonable size and location that allowed for the collection of GR data.
High resolution (8 cm) multispectral imagery was acquired over the Desert Island area, on 3 September 2015. The imagery has three visible bands (blue (480 nm), green (560 nm) and red (670 nm)), as well as red edge (720 nm) and near infrared (840 nm) bands. The response of different wetland plant species and bandwidth of each spectral band of the MSRE camera is shown in Figure 2. Ground control points and white reference panels were used to help to generate orthomosaics and white balancing profiles. Each image is 1280x960 pixels with 12 bits per pixel per band. Images obtained from the flight were mosaicked on a per-flight basis using the cloud-based MicaSense Atlas (MSA) platform. PHawk used in this work is a fully autonomous fixed wing unmanned aircraft that is hand launched and can capture data on flights lasting tp to 45 minutes at cruising speed of 50 km per hour. It is built with a single electric motor and the aircraft weighs approximately 2.4 kg with payload, with a 150 cm wingspan (Figure 3). The PHawk platform utilizes ArduPilot, an open source unmanned aerial vehicle hardware and software platform sold by 3D Robotics. The optimal flight plan for data collection is computed by the onboard flight computer based on the shape of the survey area, wind speed and wind direction once the aircraft reaches the target altitude. PHawk has an open source ground based flight instrument application known as Mission Planner that provides information about the flight situation of the aircraft, such as altitude, airspeed, remaining energy in the battery, etc. Mission Planner is based on the ArduPilot open source autopilot project which helps setup, configure and tune the aircraft for optimum performance. Mission Planner can save and load autonomous flight plans to the aircraft with point-and-click entry of way-points on Google maps. The camera trigger points from the built in GPS unit of the flight is shown in Figure 4. The imagery collected from the UAS and the location of the Phragmites is shown in Figure 5. The Phragmites boundaries are shown in yellow. The location of the samples used to train and test the supervised SVM classifier are also indicated in blue and red patches, corresponding to NP (Non Phragmites) and P (Phragmites) classes respectively, in Figure 5.
The UAS records latitude, longitude, and altitude of the aircraft for each image taken. The imagery had 70% side overlap and 70% in-track overlap. This information was uploaded to MSA to generate orthomosaics and a DSM.
Feature Extraction and Classification
In our previous research, the usefulness of texture based features for mapping invasive Phragmites was studied in detail for simulated natural colour imagery. Although computationally expensive, texture features and SVM classification were shown to be a reliable and low-cost method for mapping Phragmites using simulated natural colour images. In this research, multispectral imagery collected from a UAS using a 5-band MSRE camera has been used to map invasive Phragmites infested regions. Features such as computed DSMs, NDVI, SAVI and MAP's are studied with SVMs as an underlying supervised classifier. The proposed system for mapping invasive Phragmites is based on a stacked feature framework composed of features from four different sources. The choice of this combination of features is due to the complexity of the scene under study. The relationship between the choice of features and statistically significant classification accuracy can only be established by carrying out actual experiments. Depending on the complexity of the remotely sensed data, the choices may vary broadly.
Results
When compared to alternative methods such as human scouting and image collection from manned aircraft, classification maps produced from UAS imagery are of greater value for resource managers. The amount of time, cost, and risk involved can be considerably reduced with a UAS based mapping system.
Our analysis was performed on a computer with a 3.20GHz Intel Xeon W3565 quad-core processor using a 64-bit Microsoft Windows operating system with 12GB of RAM. The overall processing time per km2 was approximately 15 minutes. The processing time is significantly reduced when compared to our previous study based on texture based mapping (50 minutes per km2) from a simulated natural colour imagery (Samiappan 2016). The cost of mapping Phragmites per km2, excluding the cost of the UAS, camera and the software used to mosaic and classify, is about $40.