
GRI Blog
Mapping of Invasive Phragmites in the Pearl River Coastal Wetlands and the Results of its Eradication Efforts
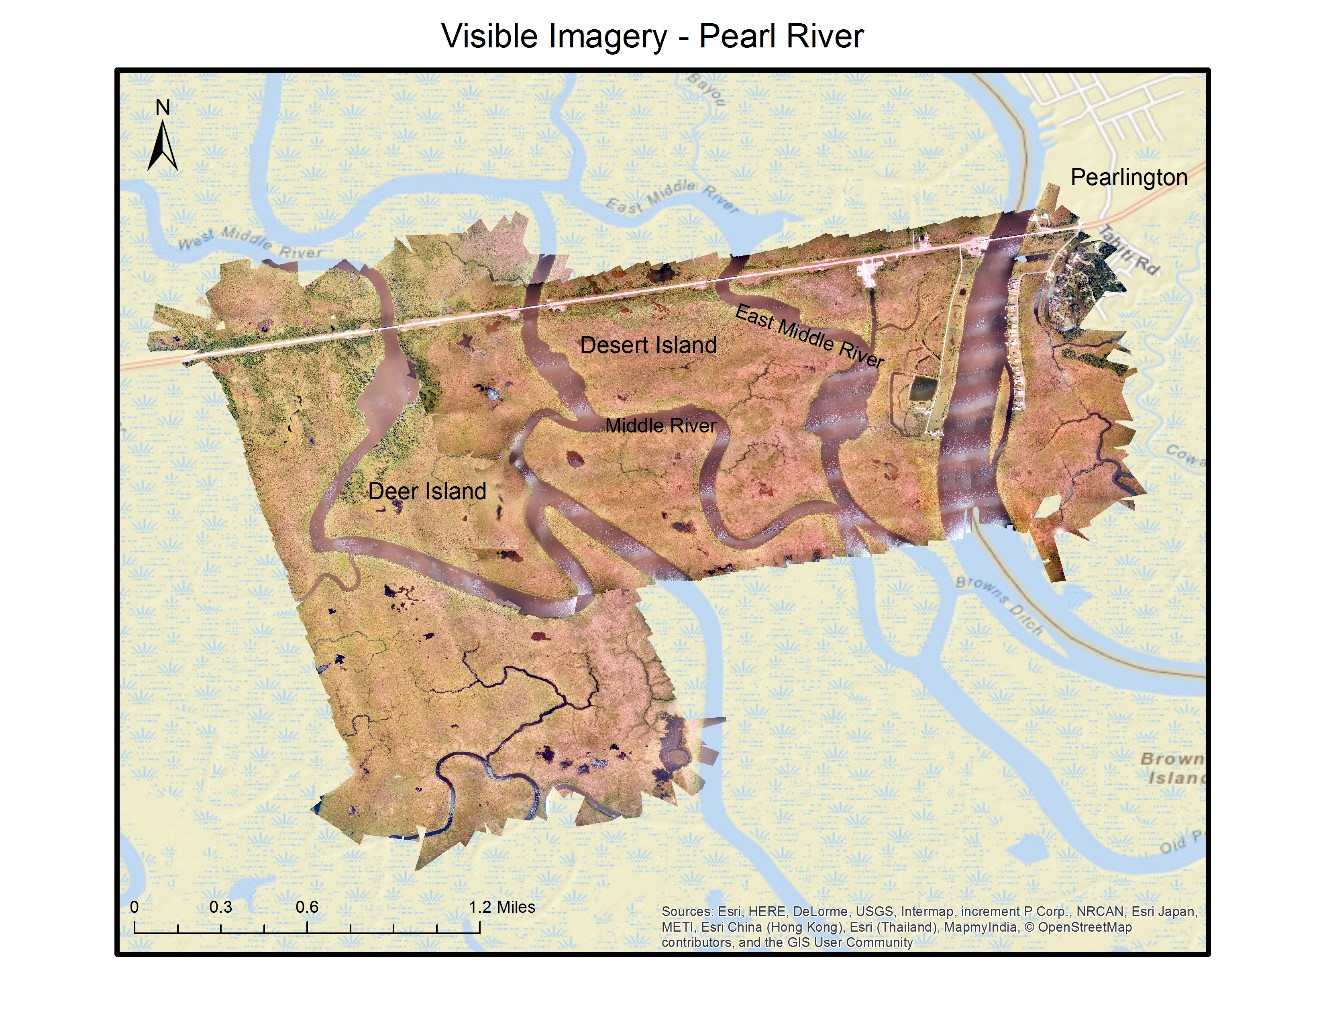
Figure 1 Visible imagery collected near Pearlington, MS on September 23rd 2014
Phragmites australis (common reed) is a perennial grass commonly found in brackish and freshwater wetlands. This invasive grass with an average height of 15 ft. appears to be rapidly outcompeting native species in many areas of the US. After colonization by Europeans, at least two subspecies of common reed have been introduced from Eurasia (haplotype M) and Africa (haplotype I). Haplotype M is rapidly displacing the native subspecies throughout its range, except for the southeastern US. Haplotype I appears to be the predominant subspecies of Phragmites invading wetland ecosystems along the Gulf Coast . Phragmites seeds abundantly and rapidly spreads vegetatively by stout and creeping rhizomes. Invasion of native ecosystems by Phragmites has been shown to have negative impacts on the local ecology, most notably through decreased biodiversity. In highly braided water bodies, like the delta of the Pearl River in southeastern Louisiana, Phragmites can also be a navigation hazard to small boats by reducing visibility as the plant regularly reaches heights greater than 15 ft. Once established, Phragmites spreads, outcompetes native plants for resources, and can eventually form large monocultures. In this paper, we elaborate our efforts to map invasive Phragmites using an Unmanned Aerial System (UAS) in the US Pearl River delta. We also demonstrate the effectiveness of this approach in-terms of both accuracy and cost.
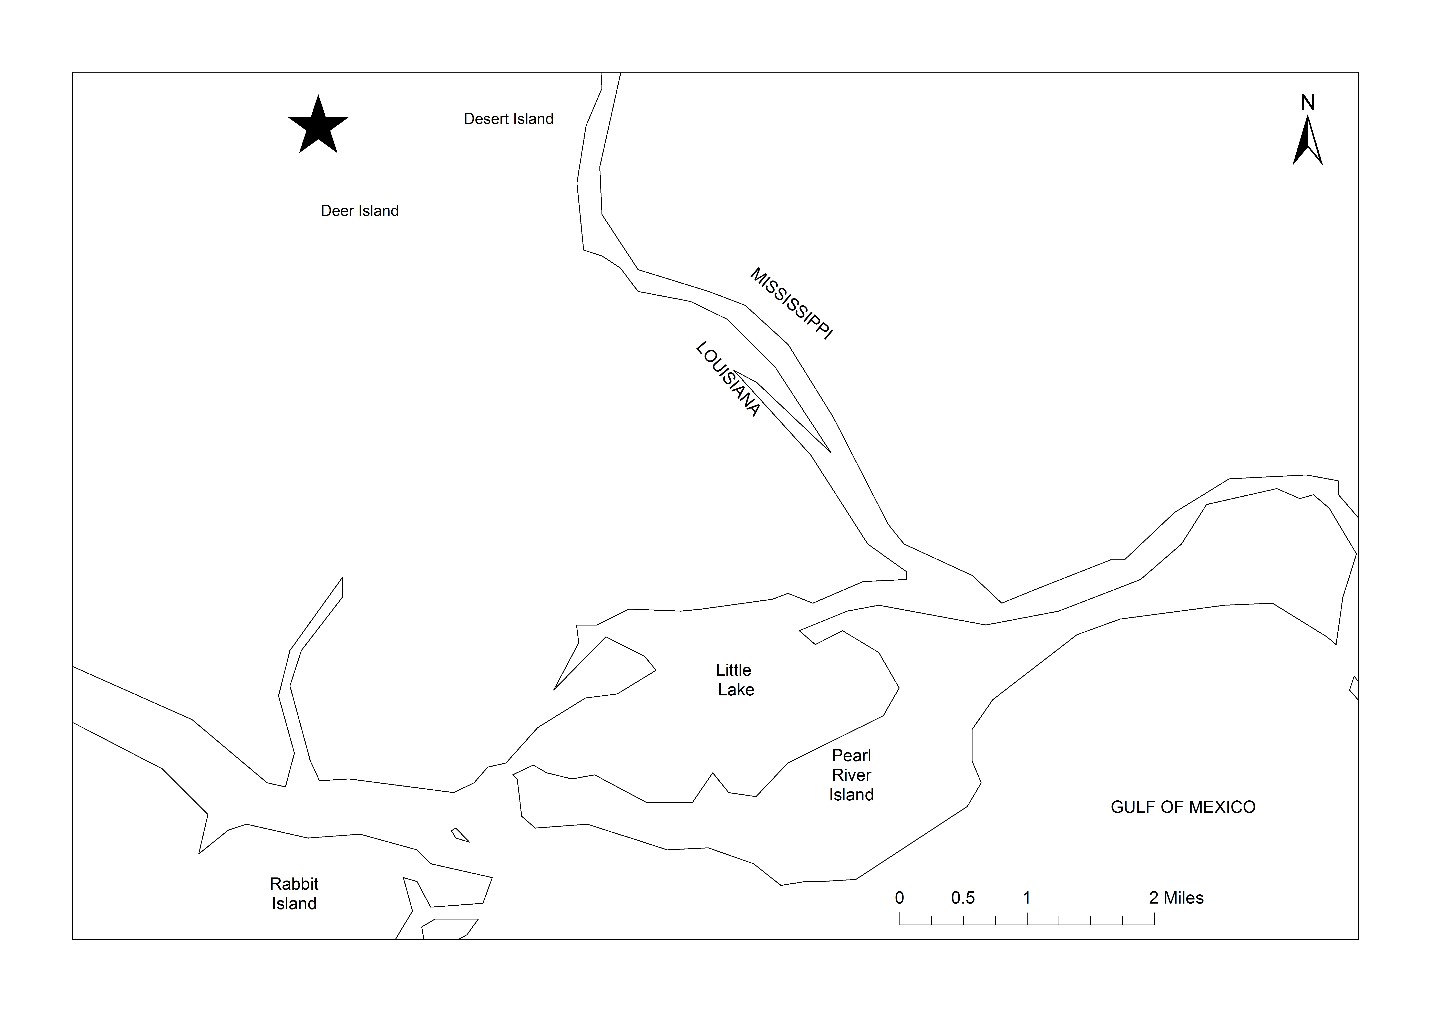
Figure 2 Map of the study area. Pearl River delta along the Louisiana and Mississippi state border
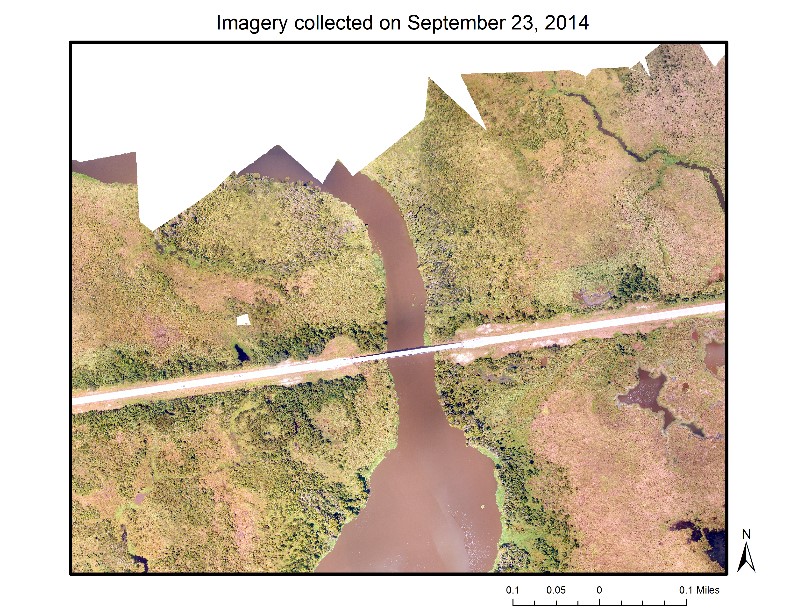
Figure 3 The Red-Green-Blue images captured using a Canon EOS Rebel SL1 on an Altavian Nova platform on 23 September 2014
The study area is the lower Pearl River basin located between southwest Mississippi and southeast Louisiana of the US (see Figure 2). The region can be classified as a tidal freshwater marsh. Such regions are influenced by the daily influx of tides, yet they have a salinity of less than 0.5 ppt. This region is located in the delta of the Pearl River and drains into the Gulf of Mexico. Due to the heterogeneous habitat, tidal freshwater wetlands harbor diverse communities of plants and animals. This region has one of the healthiest marsh complexes in the Southeast and supports between 120-140 fish species and approximately 40 species of mussels, making it one of the most species-rich river systems in the US. Brackish or mesohaline marsh is found in the lower marsh zone near the mouth of the Pearl River.
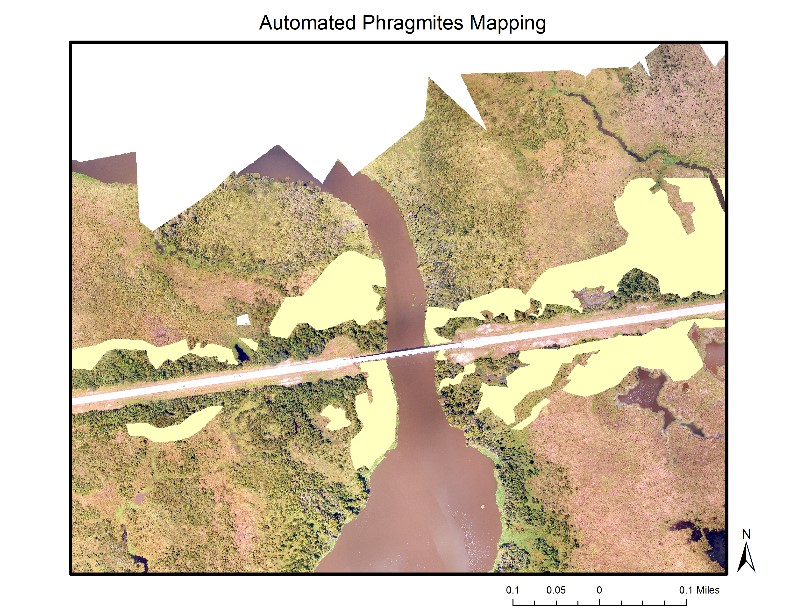
Figure 4 Classification results of Upper Bayou (marked in yellow)
Texture Feature Extraction and Classification
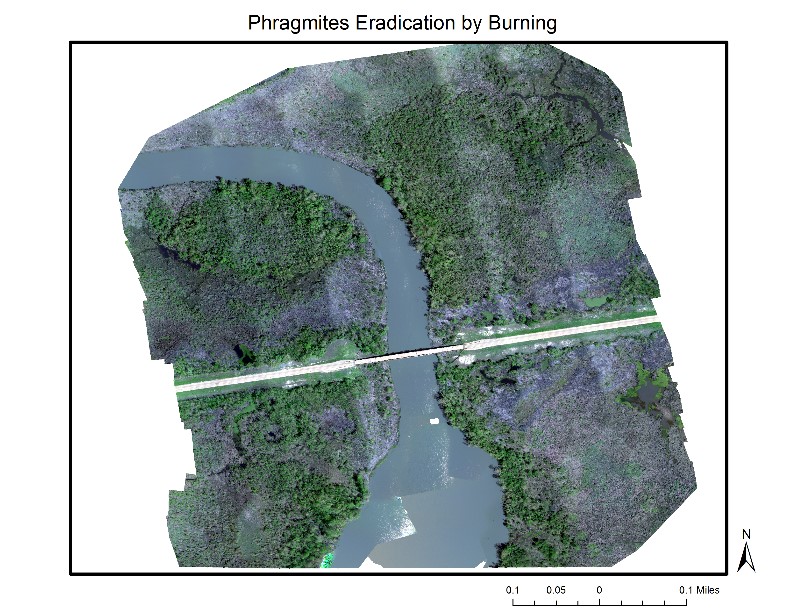
Figure 5 The Multispectral (Red, Green, Blue, Red Edge and Near Infrared) images captured using a Mica Sense camera on a Precision Hawk Lancaster platform on 3 March 2016
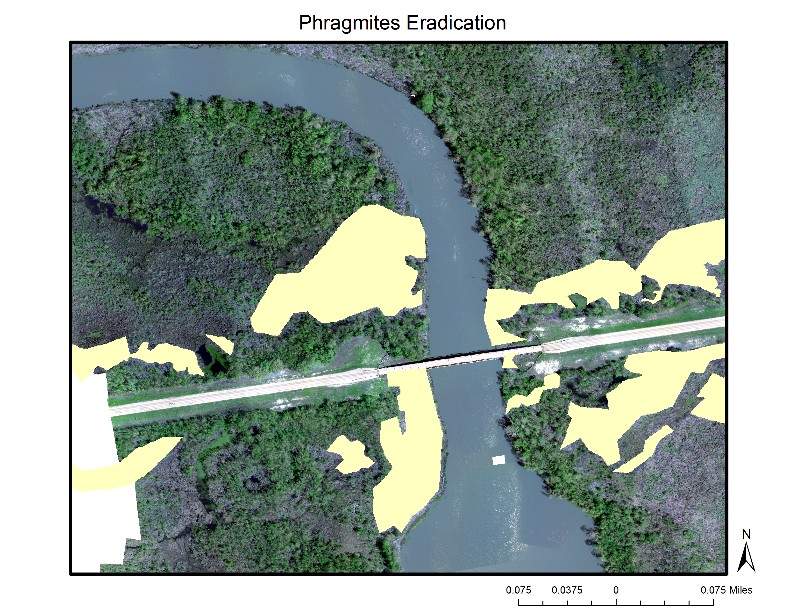
Figure 6 Burned regions are marked in yellow
Naive Bayes and maximum likelihood classifiers were initially tested to generate the classification maps. The results with these classifiers were not very encouraging. Then a Support Vector Machines (SVM) classifier is found to be a good choice for classifying the extracted texture features. A SVM classifier is a kernel based classification algorithm, which has been shown to be effective for classifying land cover types. The texture features from GLCM were linearly scaled from -1.0 to 1.0. This process normalized the numerical difference between the numerical values of the features. Optimal SVM parameters (Penalty C and Gamma y) were computed using a grid search algorithm. After obtaining the optimal parameters for training objects, SVM classifiers were trained and tested by using a LIBSVM library. The texture features and spectral bands from the imagery are used to train the SVMs. The binary classification problem is set up to classify Phragmites (P) and the non-Phragmites (NP). The training objects for both the P and the NP classes were selected randomly from multiple regions throughout the image mosaic by using ground truth information, photographs, and field notes. This ensured a representative sample from every region in the study area.
Results and Eradication efforts
Mapping of Phragmites and eradication are two non-coordinated independent operations. This paper demonstrates the ability of texture based algorithm in accurately mapping the invasive Phragmites by comparing the areas that are eradicated by US invasive coastal resource management department. While comparing these two results, readers should keep in mind that burning always causes extra damage so the eradicated areas are always larger than the anticipated regions. Figure 3 shows the area under study (also shown in Figure 2). In Figure 4, the automated mapping created from SVM classification using GLCM texture features is shown. The Phragmites areas are shown in yellow. The region under study is north of Honey Island and west of Desert Island in the delta of Pearl River. Figure 5 shows the imagery collected at a later date (March 2016) after the eradication efforts took place. This imagery was collected by using a Precision Hawk Lancaster UAS with 5-band RedEdge sensor from MicaSense.
Discussion
The image classification methods refined in this work using a very high spatial resolution imagery (2x2 inches) allowed for the mapping of small to large stands of invasive Phragmites in the Pearl River delta regions. This method is found to be applicable for stands of all heights. However the classification accuracy for each site is variable, depending on the density of patches. Our study considered the following major questions about automatic mapping of invasive Phragmites: 1) can UASs be used for successful mapping of Phragmites, 2) can texture features based on GLCM be used to distinguish Phragmites from non-Phragmites, and 3) can Phragmites be mapped by using only the low altitude high spatial resolution visible imagery. Results suggest each question can be answered with an affirmative. Based on experimental results study and comparing the eradication maps, texture features are able to distinguish Phragmites stands. There are several important conclusions that can be drawn from this study. GLCM is computationally efficient and effective technique for classifying Phragmites stands using visible imagery with pixel sizes of 5x5 cm. The ground truth information used in this study is a combination of field visits, photographs and visual analysis of the high-resolution UAS imagery by an expert in the field of aquatic invasive species. In several inaccessible areas, native trees were surrounded by dense stands of Phragmites, which resulted in the assumption that the entire area was Phragmites. This human error resulted in higher omission errors in several regions of the image. As a result, future work will be directed toward the inclusion of additional spectral bands such as red edge and near-infrared. These bands help to easily differentiate the vegetation from non-vegetation and in some cases between two different plant types. Unfortunately, the presently available multispectral cameras for small UAS have a lower spatial resolution than the RGB cameras. Digital surface models that provide height information will also be considered to better classify the Phragmites as this is the tallest grass in the wetlands.
Evaluation of Unmanned Aerial Vehicles (UAV's) for Estimating Distribution and Damage of Feral Swine
November 21, 2016 - Sathish Samiappan
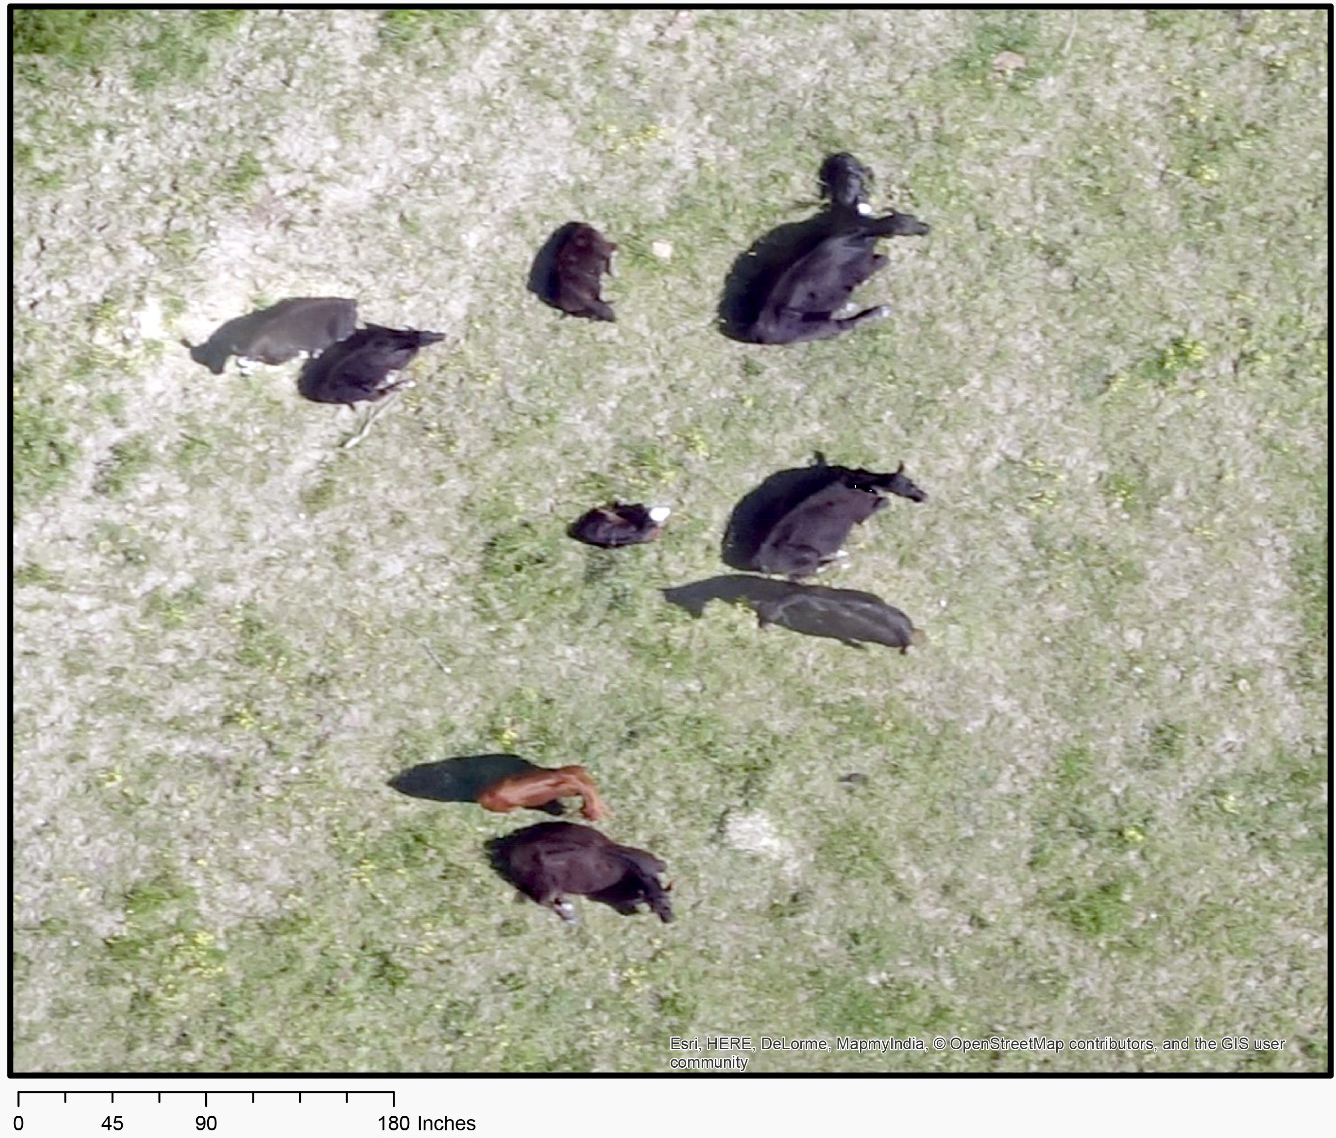
Nine head of cattle imaged from 200ft above
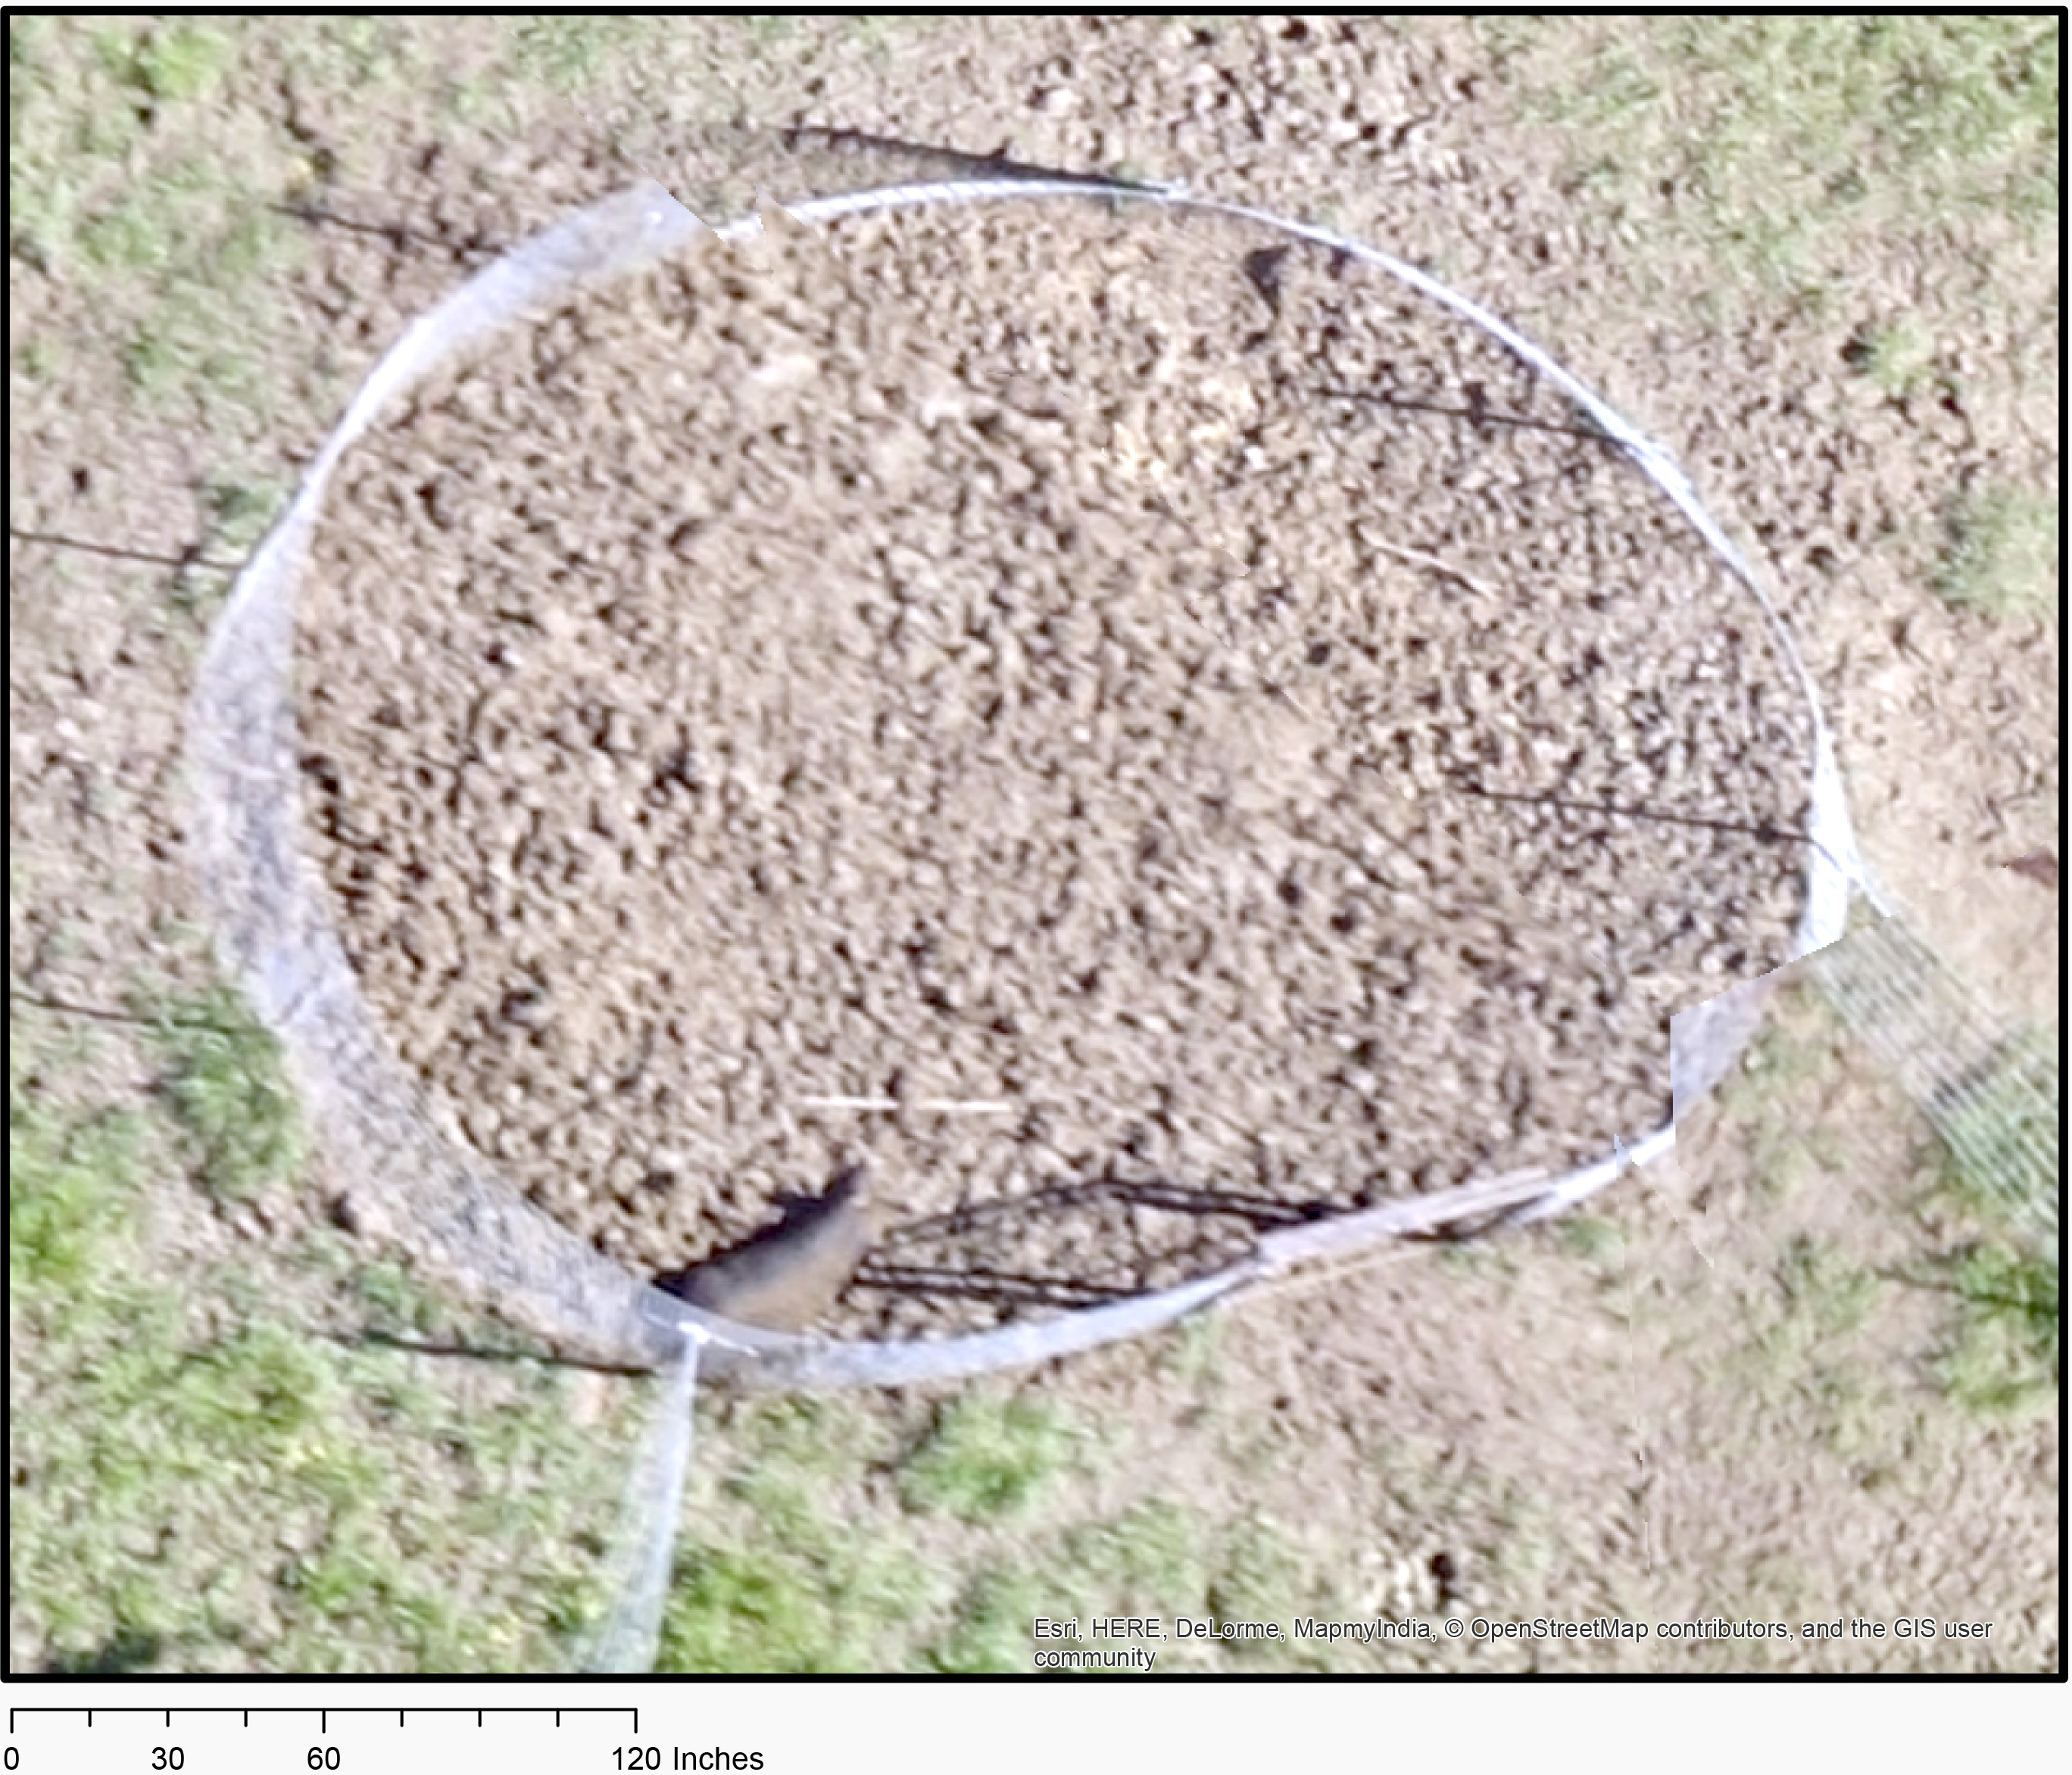
Hog trapped in a cage from 200ft imagery
Thermal video snapshot of a trapped hog
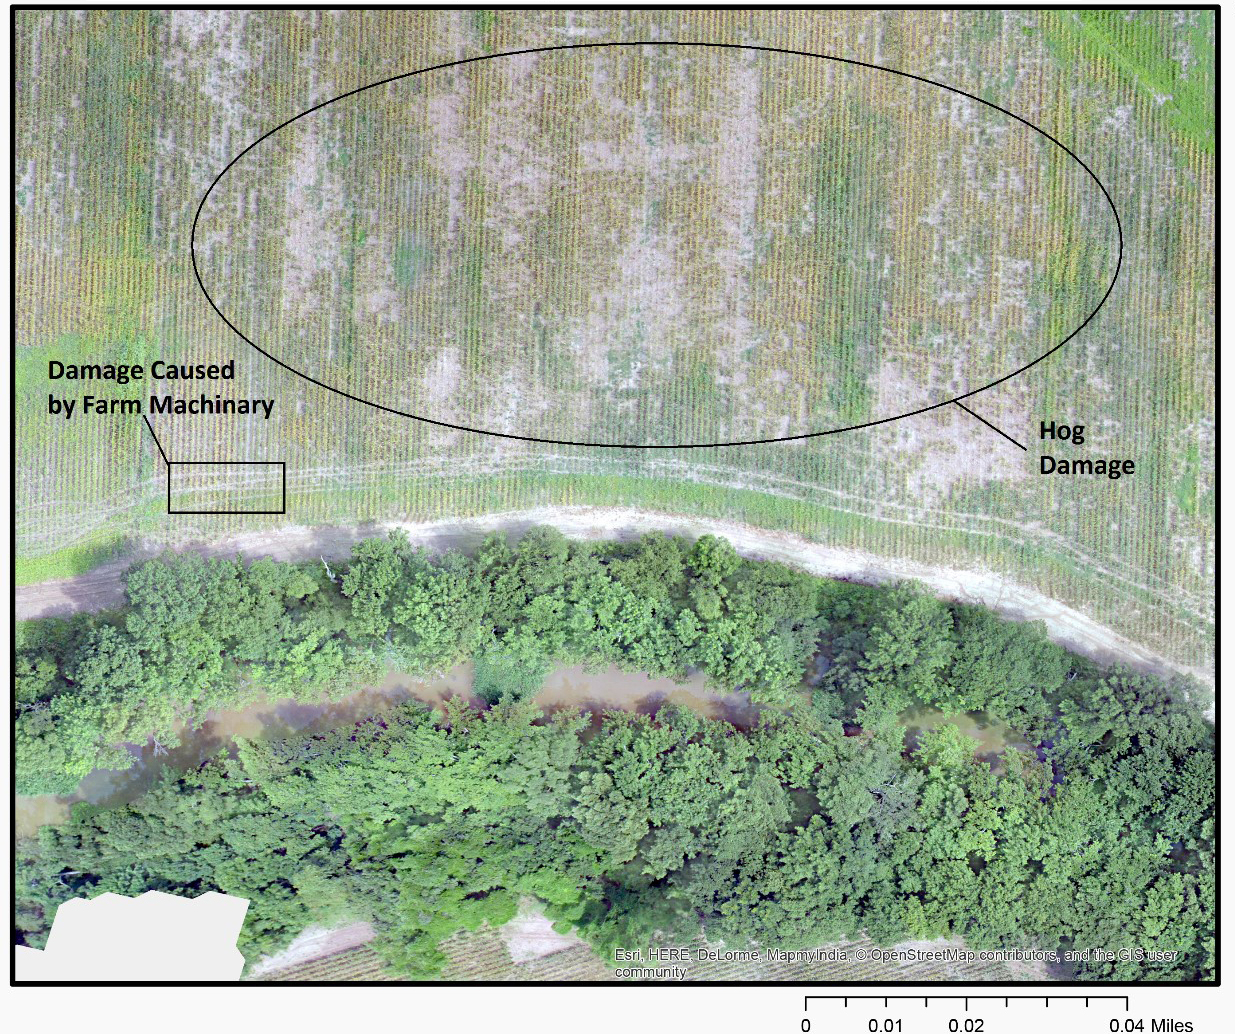
Determining corn crop uniformity on a large field is of tremendous value to monitor plant health and damages caused by hogs and deer. Texture modelling techniques were investigated to map three different densities (Low, Medium and High) on a corn field by using visible imagery collected using UAVs.
Texture Modeling Techniques:
- Gray Level Co-Occurrence Matrix (GLCM)
- GLCM is a statistical method of examining texture that considers the spatial relationship of pixels. This also known as the gray-level spatial dependence matrix. The GLCM characterize the texture of an image by calculating how often pairs of pixel with specific values and in a specified spatial relationship occur in an image, creating a GLCM, and then extracting statistical measures from this matrix.
- Segmentation-based Fractal Texture Analysis (SFTA)
- The SFTA extraction algorithm consists of decomposing the input image into a set of binary images from which the fractal dimensions of the resulting regions are computed in order to describe segmented texture patterns. In the past, SFTA has been successfully used for the tasks of content-based image retrieval (CBIR) and image classification. Its performance is superior to that of other widely employed feature extraction methods such as Haralick and Gabor filter banks. SFTA achieved higher precision and accuracy for CBIR and image classification. Additionally, SFTA was at least 3.7 times faster than Gabor and 1.6 times faster than Haralick with respect to feature extraction time.
- Wavelet Texture Analysis
- Wavelet texture analysis is based on the application of a 2D wavelet transform to each raw sub-image, which essentially consists of transforming a matrix of numbers (pixel intensities, as we are analyzing single-channel or grey-level images) into another, with the same size (same overall number of wavelet coefficients), containing blocks of coefficients for different scales (from the finest to the coarsest scale, which is known as the decomposition depth) and along three different directions (horizontal, vertical and diagonal).
- Texture Analysis based on Gabor Filters
- In image processing, a Gabor filter is a linear filter used for edge detection. The frequency and orientation representations of Gabor filters are similar to those of the human visual system, and they have been found to be particularly appropriate for texture representation and discrimination. In the spatial domain, a 2D Gabor filter is a Gaussian kernel function modulated by a sinusoidal plane wave.
Simple cells in the visual cortex of mammalian brains can be modeled by Gabor functions. Thus, image analysis with Gabor filters is thought to be similar to perception in the human visual system.
Usually, a filter bank consisting of Gabor filters with various scales and rotations is created. The filters are convolved with the signal (image), resulting in a so-called Gabor space. This process is closely related to processes in the primary visual cortex.
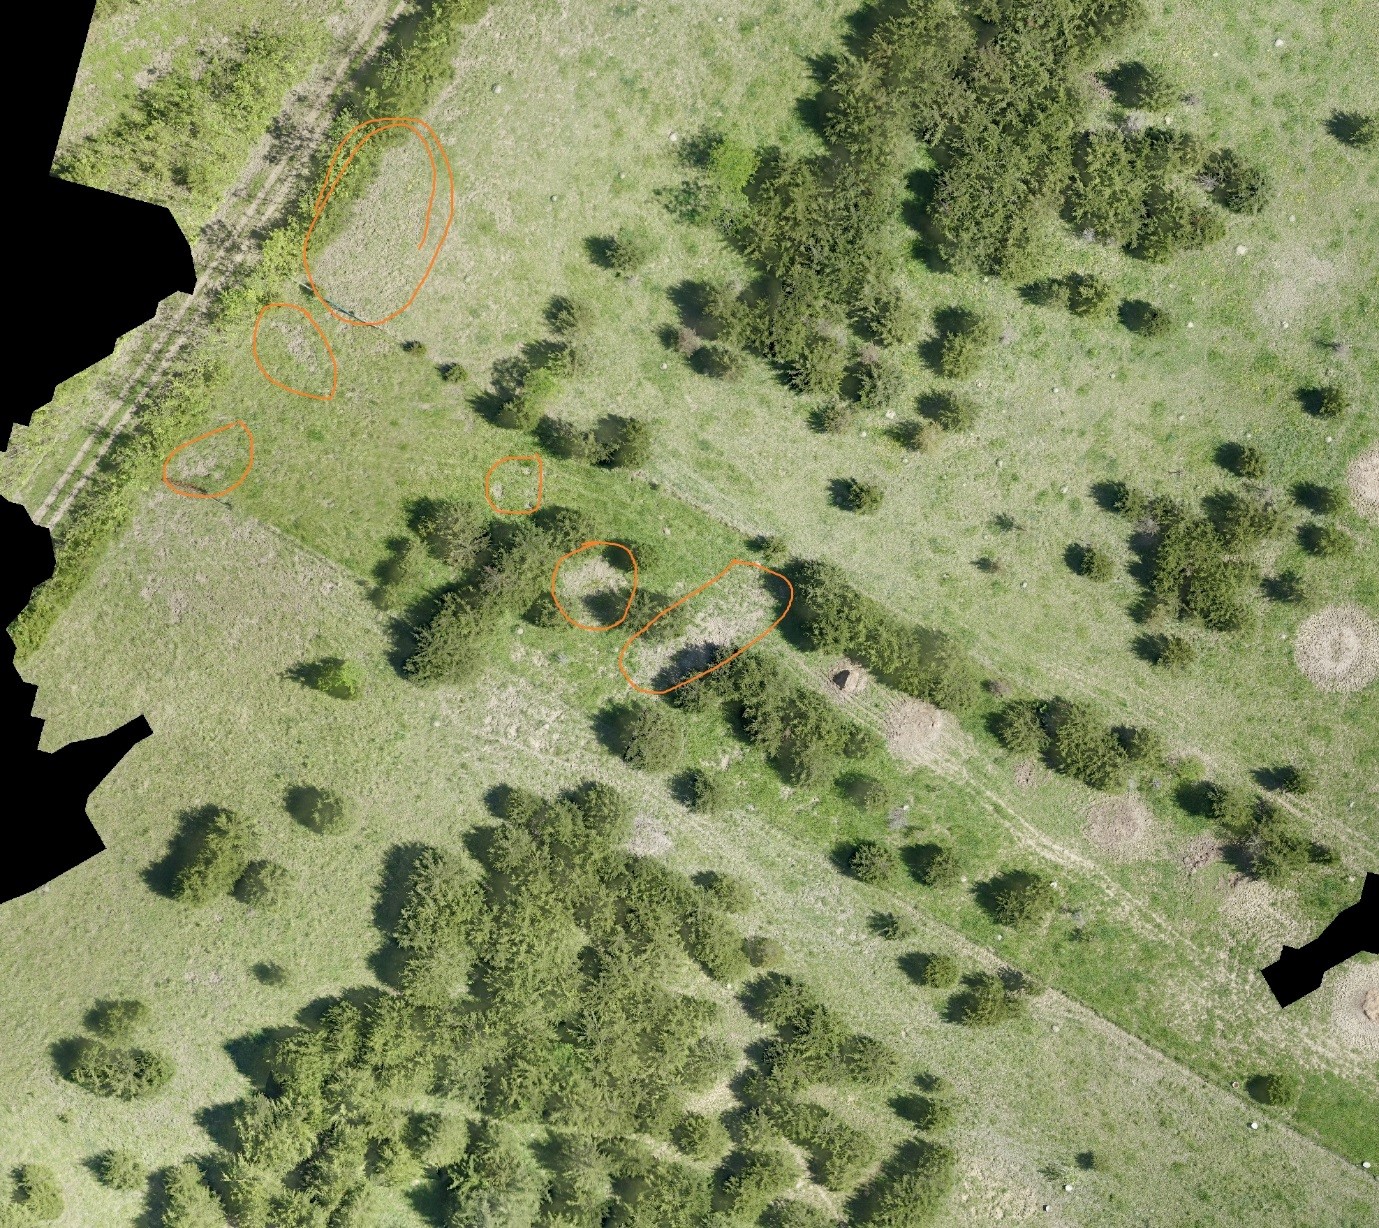
Hog damage at the study site delineated by a human expert with field knowledge (not from looking at the UAV imagery)
Visible Damages caused by hogs in the field on right
Evaluation of Unmanned Aerial Vehicles (UAV's) for Estimating Distribution and Abundance of Waterbirds on Catfish Aquaculture Facilities.
November 21, 2016 - Sathish Samiappan
Double-crested cormorants, American White Pelicans, and other fish eating birds are abundant in Mississippi and there is considerable stakeholder concern over the apparent increase in utilization of cultured catfish by fish eating birds. These factors have resulted in concerns regarding depredation impacts and economic losses to the catfish aquaculture industry attributable to fish eating birds.Proportional use and count information are important in determining the economic impact of fish eating birds to the catfish aquaculture industry. Historically, surveys have been conducted from the ground or by air using certified pilots, typically in fixed wing aircraft. Recent advances in unmanned aerial vehicle (UAV) technology may provide for a more cost effective and less risky solution for the conduct of aerial surveys of waterbirds on catfish aquaculture facilities and at their roost sites.
We conducted UAV based surveys at selected catfish aquaculture facilities in the primary catfish aquaculture producing areas of Mississippi. We evaluated the resolution and extent of coverage necessary to provide for UAV remotely sensed and pattern recognition based censuses of fish-eating birds.
Precisionhawk and Robota UAV platforms were used to collect visible imagery at different altitudes from two different sites. The first site is located north of Leland in Washington county in Mississippi (-90.891425 33.447374 Decimal Degrees). Imagery from four flights at 200ft, 400ft and 600ft altitudes were collected over 80 acre site by using a visible Sony RX-100 20MP camera on Robota Tritan UAV. This data was collected on 09/08/2014 and 10/18/2014. The ground resolution corresponding to UAV flown at 200ft, 400ft and 600ft are approximately 1.2cm, 2.5cm and 3.5cm (0.5 inch to 1.25 inch) respectively. The second site is located south of Indianola in Humphrey county in Mississippi (-90.539764 33.327089 Decimal Degrees). Three flights at 200ft, 400ft and 600ft were collected over 120 acre site by using a visible Cannon camera on Precisionhawk Lancaster UAV. This data was collected on 03/24/2015. The ground resolution corresponding to UAV flown at 200ft, 400ft and 600ft are approximately 1.5cm, 3 cm and 4.5cm respectively (0.75 inch to 2 inch). In all the seven flights, a large image mosaic was constructed out of overlapped individual images. In both locations, American pelicans and blue herons were spotted. We could not spot the double crested cormorants on these locations to collect the imagery.
Pattern Recognition Experiments and Results
Pattern recognition algorithms such as color segmentation and template matching were applied on the imagery to automatically count the birds.
Figure 1 and 3 shows two snapshots of white pelicans and blue herons respectively that are used for performing color segmentation. Figure 2 and 4 shows the results of segmentation. It can be clearly observed that this algorithm can be used to effectively segment the birds in the imagery. The algorithm requires manual/automatic selection of the color of the target object that needs to be segmented in the first step. Delta-E color segmentation is performed in the Lab color space. This algorithm is very fast and accurate in segmenting a single color tone (average over a region) objects such as white pelicans and blue herons. A connected component object counting algorithm is then used to accurately count the segmented objects resulting in the estimation of number of birds in the imagery.
Figure 5 shows the snapshot where both white birds and blue herons were present. Color segmentation is very useful in identifying and segmenting a bird purely by using its color. Template matching algorithm can be employed to identify birds based on both color and shape. Figure 6 shows the result of template matching algorithm identifying eight blue herons in the image.
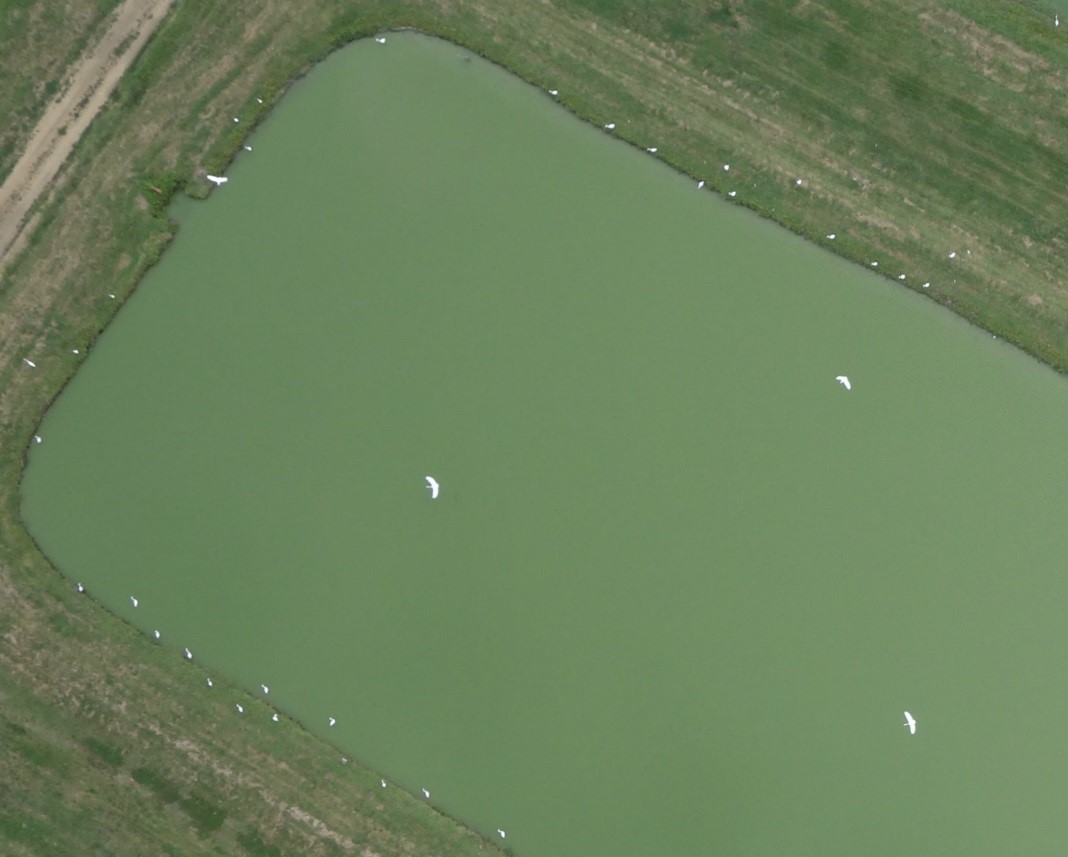
Figure 1 Snapshot of a region where several white pelicans were spotted in the imagery
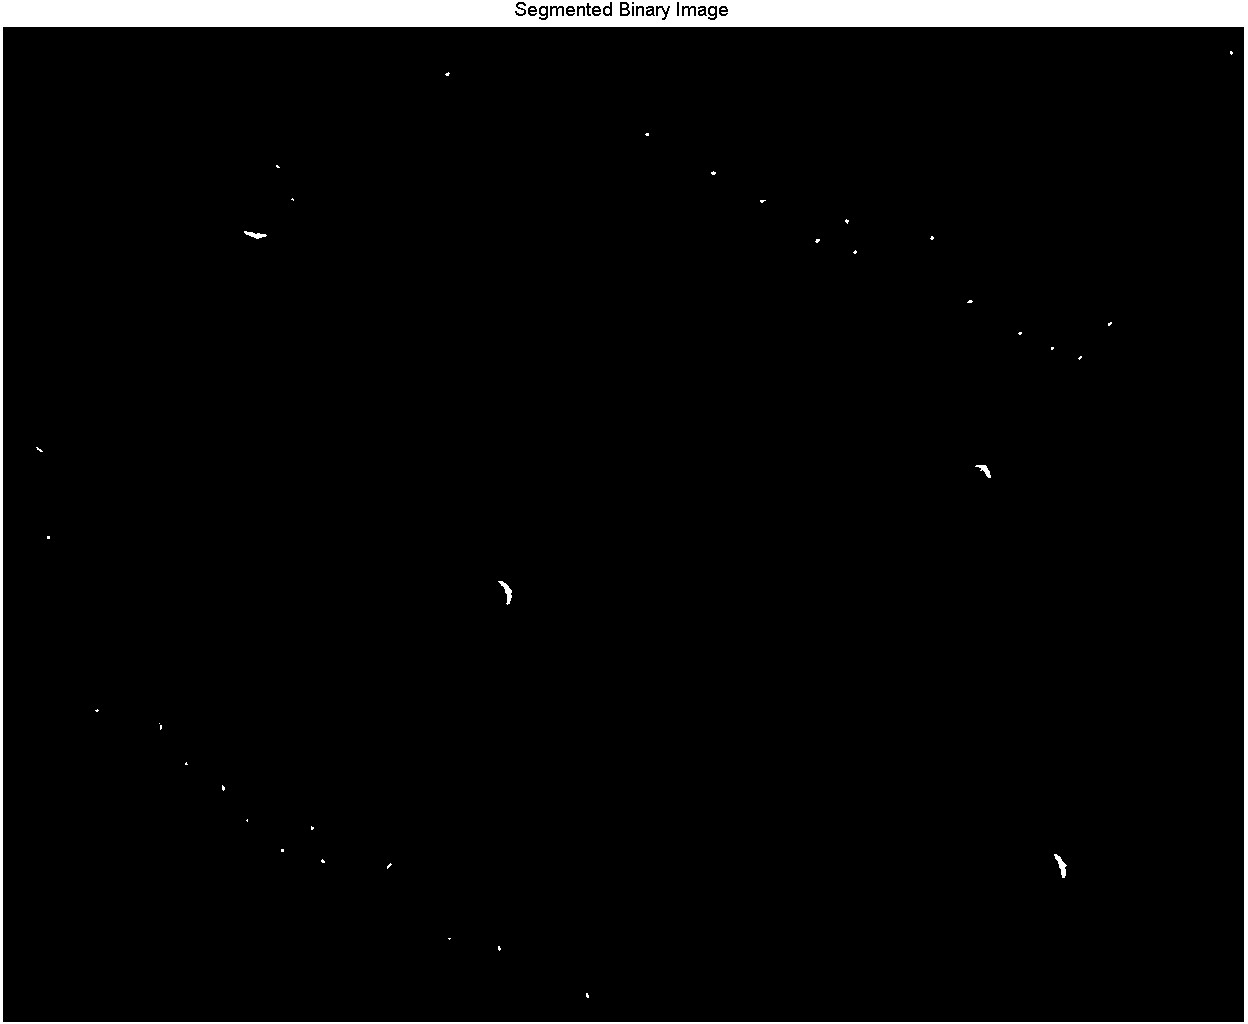
Figure 2 Result of Delta-E color segmentation algorithm to segment the birds
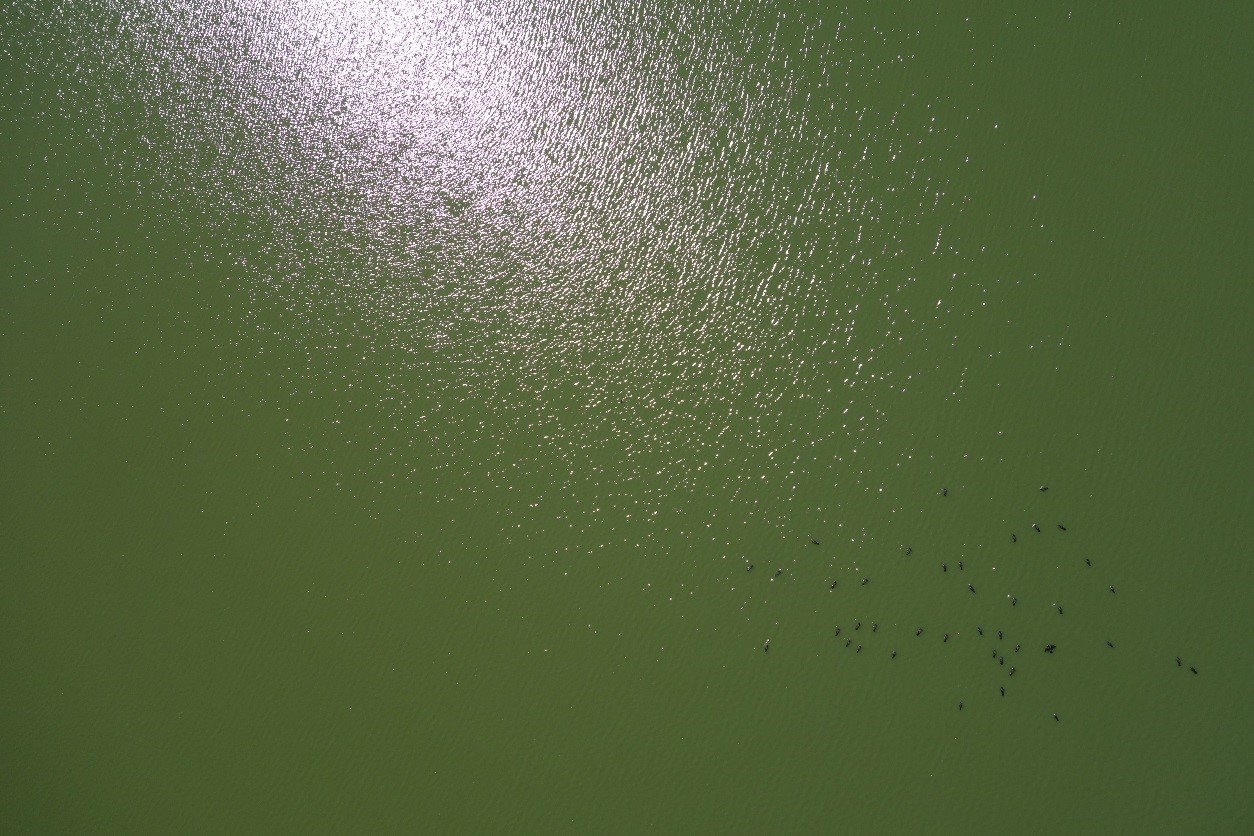
Figure 3 Snapshot of a region where several blue herons were spotted in the imagery
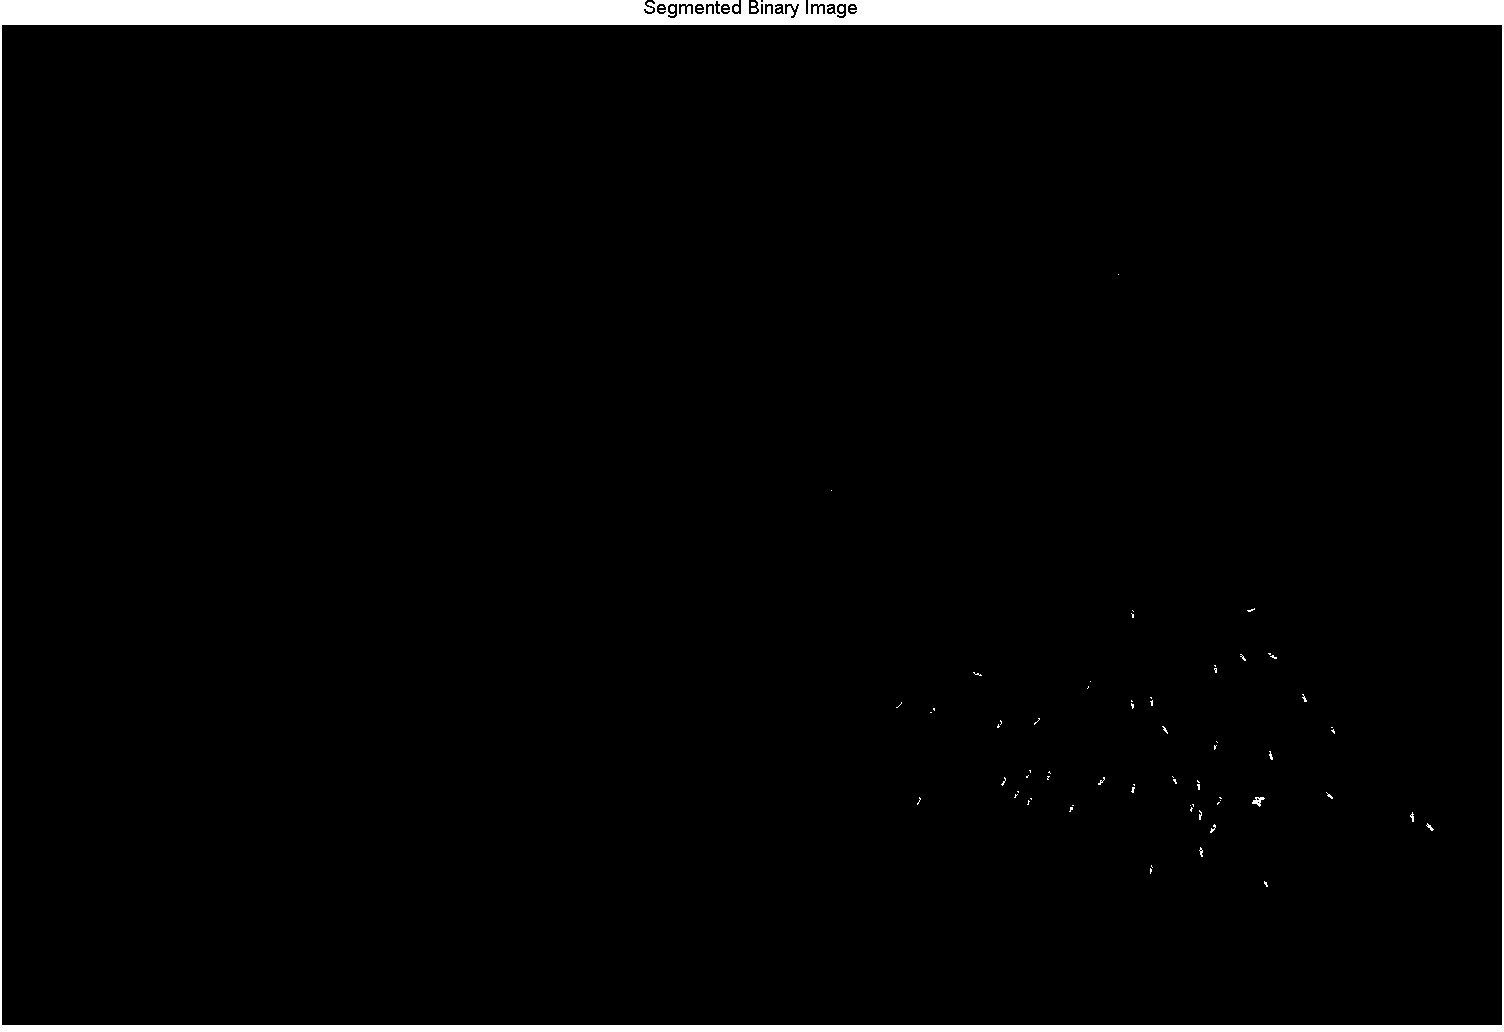
Figure 4 Result of Delta-E color segmentation algorithm to segment the birds
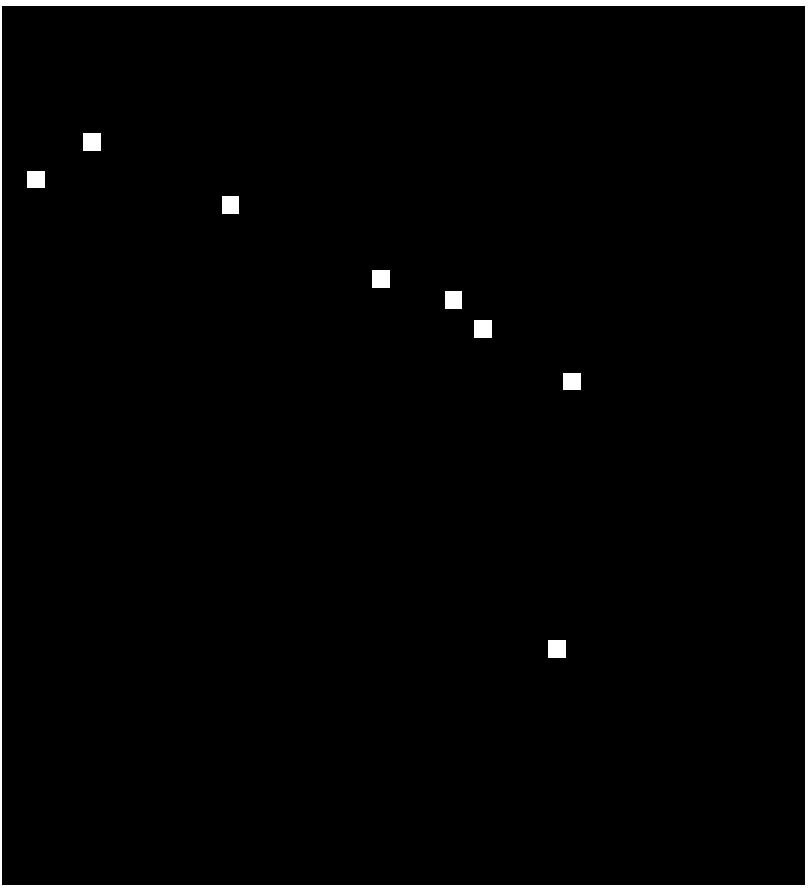
Figure 5 Snapshot of a region where several white pelican and blue herons were spotted in the imagery
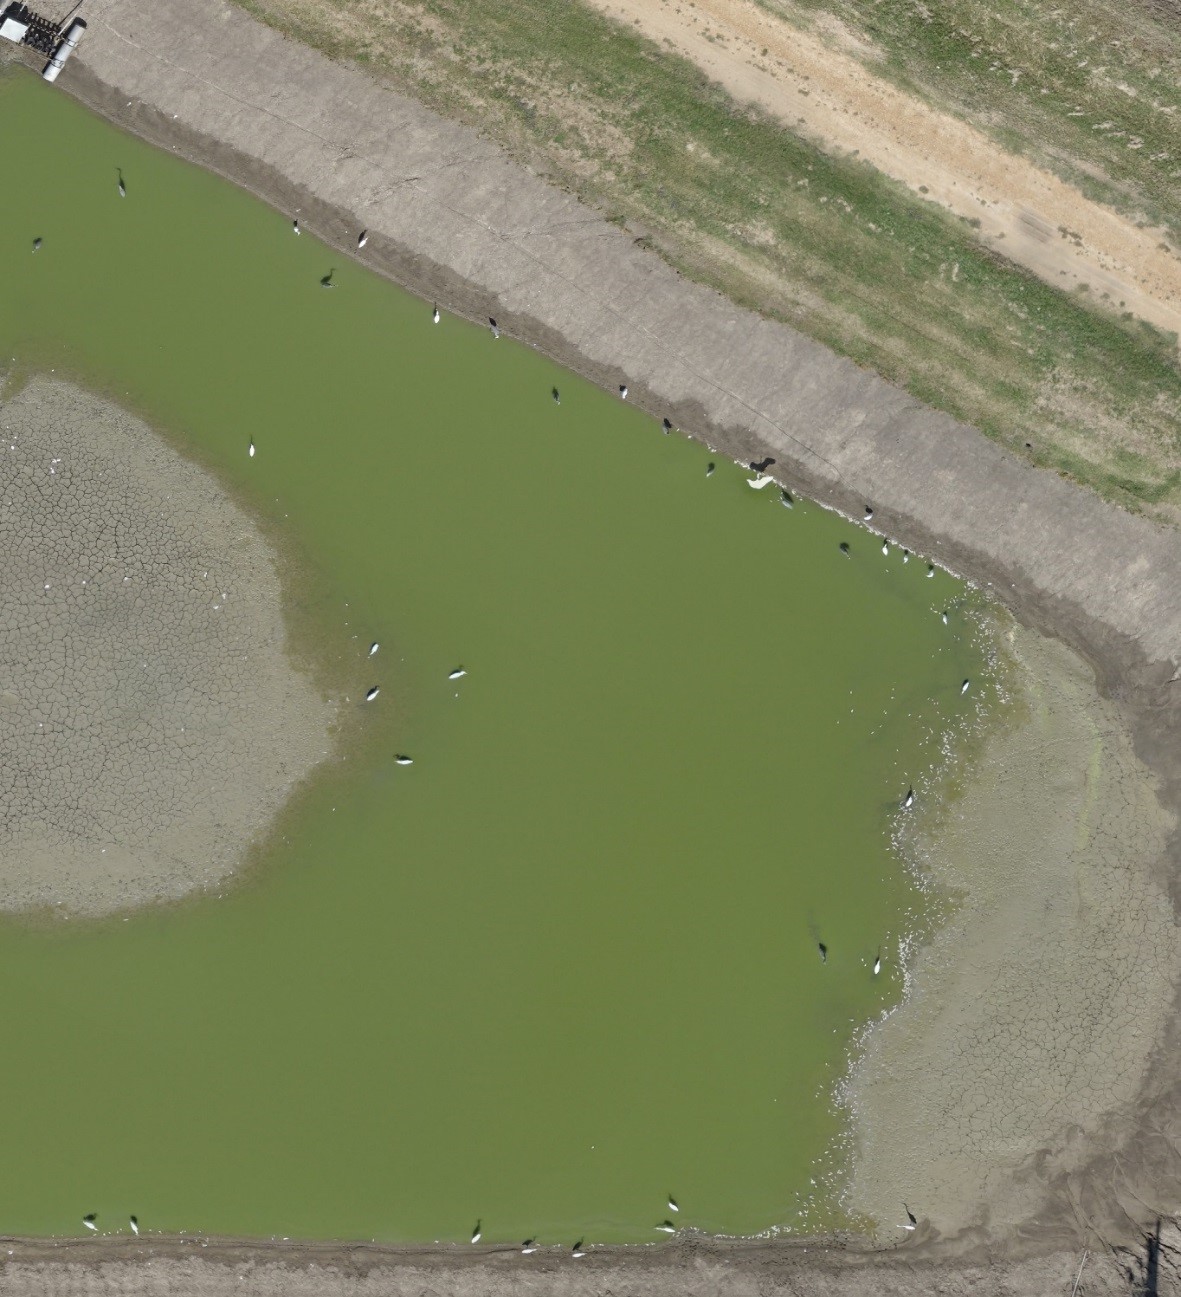
Figure 6 Result of Template matching algorithm to segment the blue herons